
This is a post pulling together a few elements/features of Azure to demonstrate how to solve an issue, even if the core use case does not affect you the way the problem is solved can be applied to loads of other situations.
In this case my problem being that my AADDS account is getting locked out (for the unfamiliar AADDS is Microsoft's 'managed' active directory service) - so essentially something is trying to authenticate against AD with wrong password - this is causing the account to be locked out - but where is this coming from?
Normally in traditional AD this is easy to find out - you can just check event logs - however in the managed AADDS you have no direct access to the domain controllers and you can't even use event viewer to connect to the remote managed domain controller machine - that is also not allowed - so how can we find this out?
Well the first step is to enable the AADDS PaaS service to gather the logs and then send it to somewhere we can access.
Like many other PaaS services this is enabled from the diagnostics blade of the service - in the screenshot below you can see that screen for AADDS. In my case I'm actually sending the data to three distinct places - a storage account, a log analytics workspace and an event hub. There are reasons for all of these - but for this particular use case the only one I actually need is the log analytics one.
I then choose to send all the available data sources to this location (the list of available data you can see displayed at the bottom of the screenshot)

Now for those of you not familiar with it log analytics is a log ingestion and querying platform - along the lines of Splunk or the ELK stack. Basically you send a whole load of log info into it - you can then query those logs using a SQL like language called 'Kusto' (or KQL).
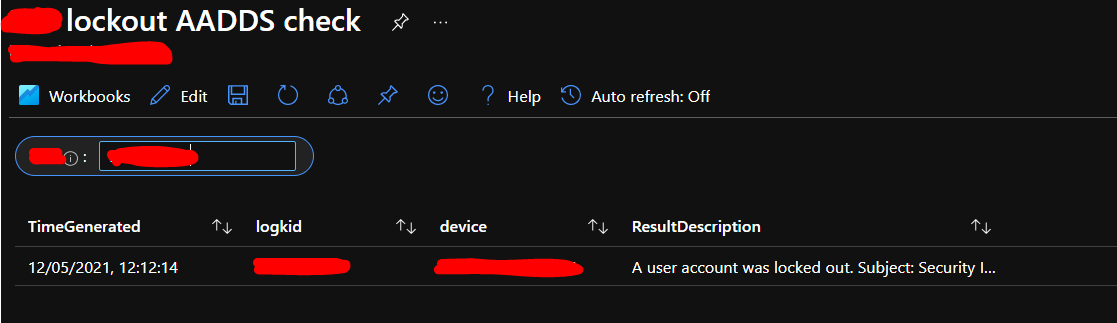
So for our use case it enables us to search for lockout records and then display the details of those to identify where it's coming from.
If we browse to our log analytics workspace - we can see that by activating the above diagnostics Azure has created some new 'tables' (I call them tables as I'm not sure what the correct term is and my background is in databases)


AADDomainServicesAccountManagement
| where TimeGenerated >= ago(1d)
| where OperationName has "4740"
| parse ResultDescription with * "Account Name:" AccountName "Account Name:" id "Additional Information:" dummy "Caller Computer Name:" device
| project TimeGenerated, id, device, ResultDescription
| sort by TimeGenerated desc

AADDomainServicesAccountManagement
| where TimeGenerated >= ago(1d)
| where OperationName has "4740"
| where ResultDescription contains "{ID}"
| parse ResultDescription with * "Account Name:" AccountName "Account Name:" id "Additional Information:" dummy "Caller Computer Name:" device
|project TimeGenerated,id,device,ResultDescription |sort by TimeGenerated desc

Save up to 75% on your cloud bill by recognizing cost leaks in your infrastructure. With AWS, Azure and GCP continually changing cloud services, SKUs and pricing; optimization has become an on-going action to pick the perfect resource at the right time.
ReplyDeleteAutomate Cloud Control
Score the freshest kicks without breaking the bank style doesn’t have to cost a fortune. You’ll love hunting down the best shop sneaker deals for trendy, budget-friendly finds.
ReplyDeleteI recently used a locksmith Palm Beach Gardens, and their quick response really saved me during a late-night lockout.
ReplyDelete