This is the first in a series of 2 posts dealing with how you can use Azure to monitor if a website is up and running and track the response time of that.
I've split it into 2 cases - the first (simpler) one is checking if a public facing website is up and running, the second will deal with doing the same thing for a private internal website - that's a longer more complex write up so I'll get the easy one out of the way as it shows some of the basics too which are still relevant to the second part.
So first up we're going to take advantage of a feature called 'application insights' - this has a whole load of stuff in it that I'm not going to cover here that can do things for PaaS services as well as on premises IaaS services if you install the right additional software and configure it.
I'm just going to use pretty much the simplest thing that comes with it.
So first up we create a new app insights object in the portal - so search for app insights and just click new:
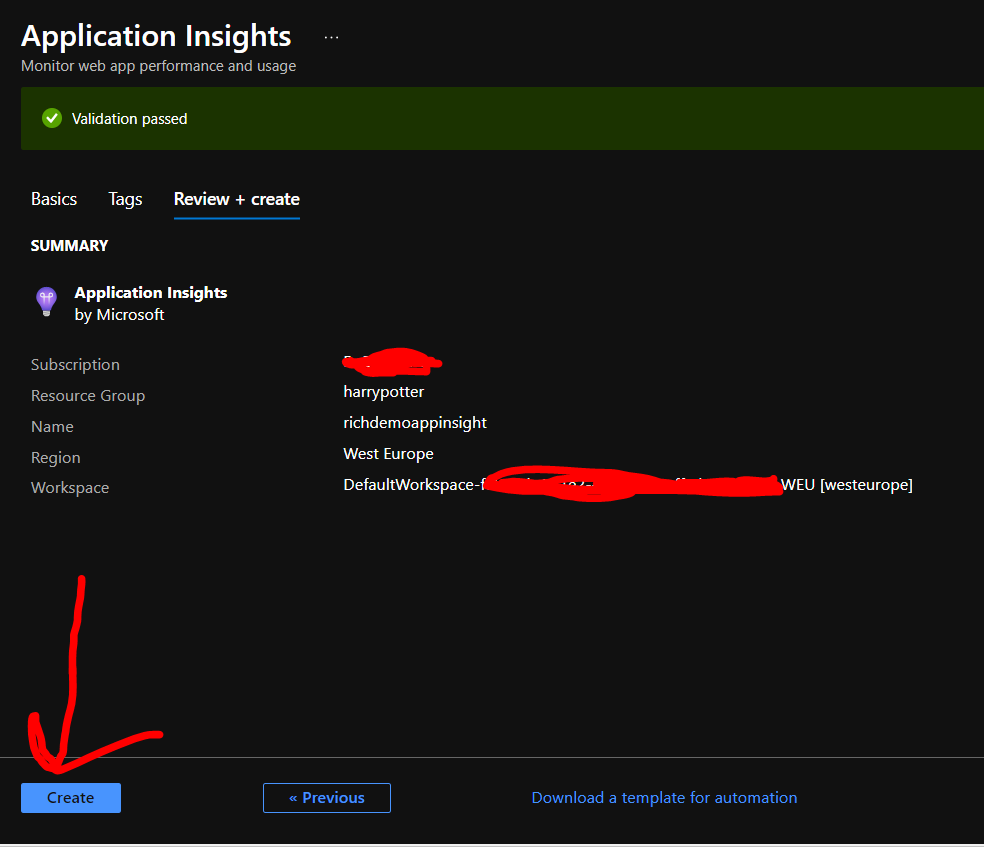
Fill in the usual basic information about location and resource group - there is a newer option about choosing between classic and workspace-based. This is just a decision about where the data is stored - if you chose classic it is log analytics as far as I can tell but it's hidden and you can't access it as a separate workspace - if you choose workspace-based then its normal log analytics - this now seems to be the default and is the most sensible option to choose.
Once that's all validated click create
Wait for it to create and then navigate to the main blade for the newly create resource. Once there click on the availability link shown below:
Once in there click 'add test'
Now here is where we define what we are actually checking - I give this a name and choose URL ping test (so a simple is the site up and how long does it take) - there is a more complex multi step web test where you could do some sort of navigation round the site - but here I'm just keeping it simple. I then specify the url to check (my blog site) along with how often to check and also where to test from. That's useful as you can check from different regions of the globe to see how it behaves (and I guess how well any CDN system might be working).
Click create and that's it - I now have a test running every 5 minutes to see if the website is up and running - you can see the first results of that below - the test ran once and the website was up and the page was served in 616ms
There are various options then to change the time range and the style of graph plotted - but the basics are all done - my website is now being checked.
I can then if i want to build alerts on top of that - if website is down do 'X' if website is slower than 'Y' seconds more than 3 times in a row do 'Z' - it's very flexible
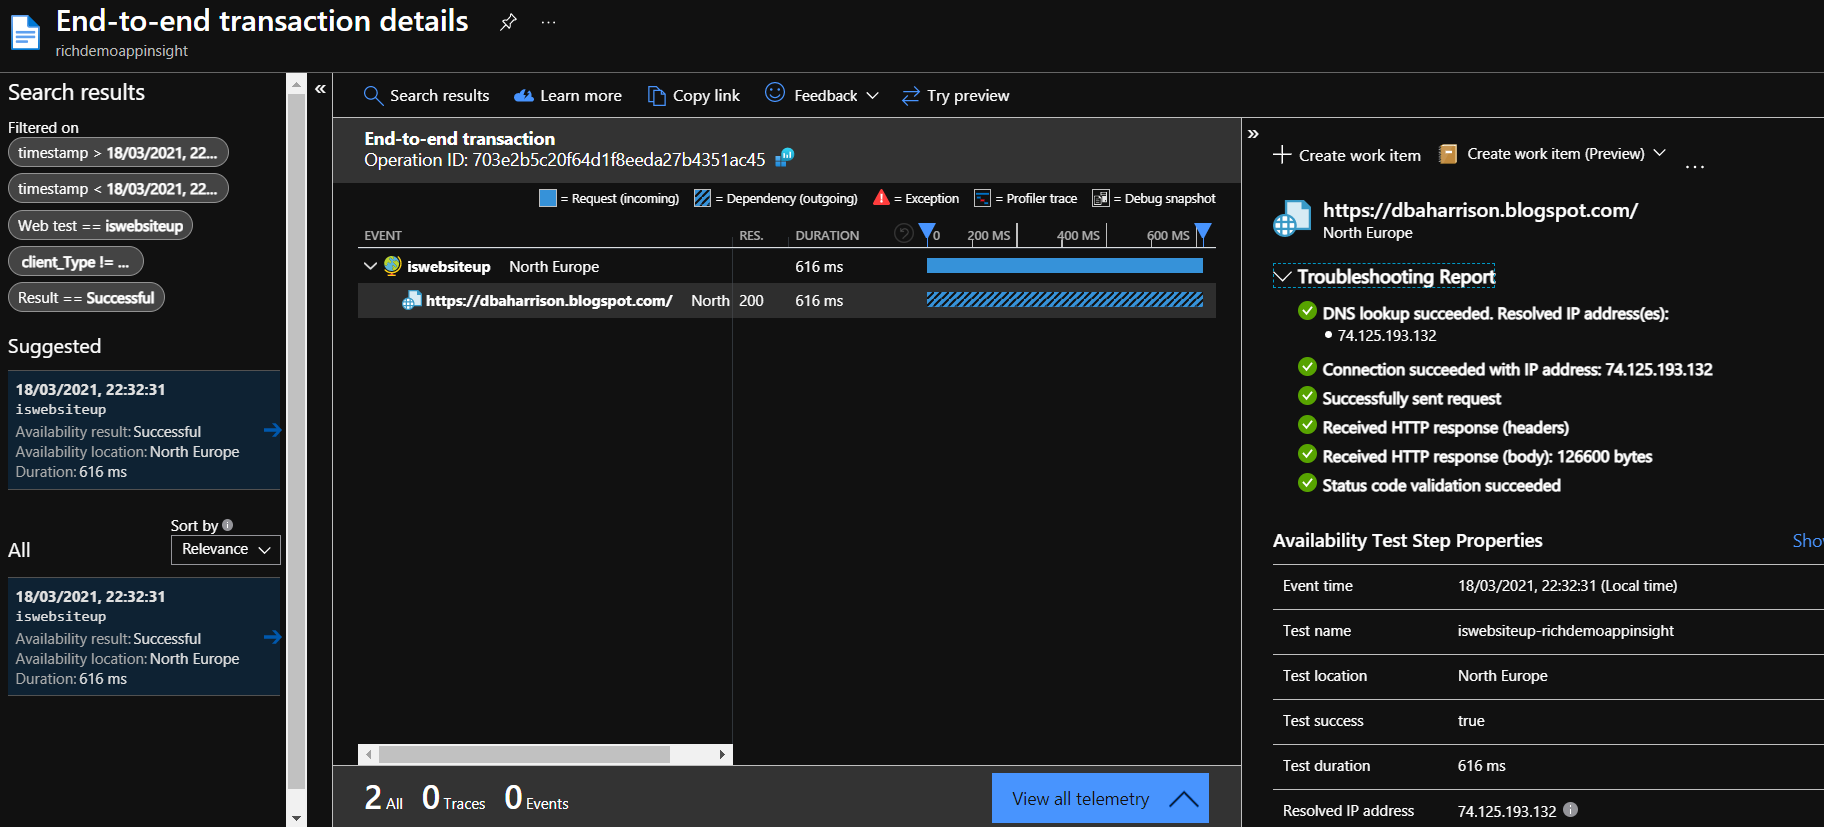
You also get quite a bit of detail of when it ran the test - see pic below:
You can also see the breakdown and speed of the various locations the 'probes' are running from that check the website.
You can even produce SLA reports on the site availability - thought there is not much to show here in my simple example
This is really useful - you can very rapidly set this up and check your public facing sites to give some really good info on if your public presence is actually up and running and how well it is working for different user bases all over the globe.
Part 2 to follow with how you do this same thing for internal sites.....when I muster up the energy to capture the screenshots and remember all the steps.....


"Great insights on using Azure for website uptime monitoring! Just like Skynode keeps my gaming library organized, these tools ensure our sites are always accessible and running smoothly.
ReplyDeletefigured it out eventually, alert action groups or something. yeah they really need to work on their ui dont they ;P at least im not stuck with aws.
ReplyDeletenitrites.net
Delete