This is a short post about my new favourite feature in the Azure portal - Workbooks. These allow you to create some nice interactive visuals based on a variety of datasets. Microsoft themselves have some of the portal screens based on this technology and it seems to be something they are really investing in. It kind of takes the dashboards concept to the next level.
What I'm going to show here is a nice 'honeycomb' visualisation which I think is quite effective.
For my example I'm going to use a real world thing I've just built - in this case I want to show the main users of traditional netapp fileservices. To discover that I'm making use of the data fetched by the Azure insights agent - this collects metrics to make the performance and map screens work in VM blades of the portal. In my case I also have a number of 'non-Azure' servers configured with Azure ARC - these are also configured with that same MMA agent fetching the data. The data that is being used here, that the agent fetched, is stored across a few log analytics workspaces - I now just want to query across all of them and create a nice visual.
So here is how I did that:
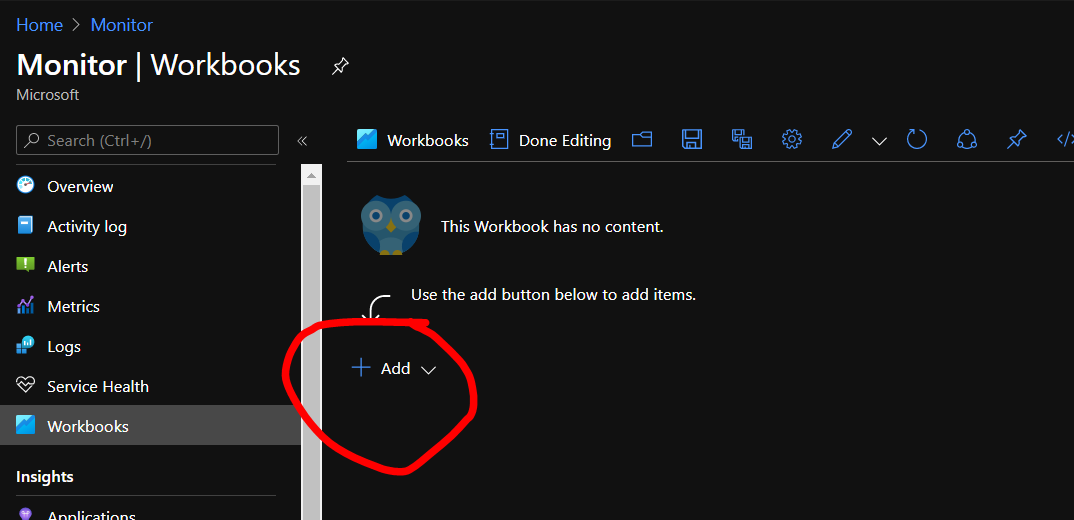
To create a workbook don't fall into the trap of going to the workbook screen and trying to add it there - there is no add button....
Instead navigate to the Azure monitor page, go to the workbooks option and then click create an empty workbook.
Once you have done that we then need to add an element to it
In my case i want to add a 'query'
We are no presented with this screen - in which I want to choose the 'logs' option and then 'log analytics', I can then select one or more workspaces for the query to run across (in my case quite a few more) and then I just paste in my pre-written query. I then click the run query button to check it's returning what I want.
What's nice here is that it's enabled the multi workspace query - this is possible directly in log analytics by use of the union keyword but it's a little messy to write - especially when you have lots of workspaces - this screen keeps it nice and clean.
The query I'm running is shown below - so I'm looking in the VMconnection 'bucket' of data that the agent has been pushing the data into - then I'm saying I'm only interested in traffic to certain IP's (the netapp filers) on port 445 (the file services port). I'm then summing up the amount of data sent across and grouping it by the computer and the netappfiler destination ip. So I get a nice summary of how much data each computer sent to each filer.
VMConnection  | where DestinationIp in('ip','ip','ip','ip') and DestinationPort =='445'
|summarize sum(BytesSent)+sum(BytesReceived) by  Computer,DestinationIp |sort by Column1 desc
So that on its own is quite useful - but I want to make it look nice.
To do that I switch the visualisation to graph as shown below
I then choose the 'hive clusters' option and set the nodeid to the computer column (this is the value used for each hexagon in the output) and I group by the destination ip ( so I get a distinct honeycomb for each filer)
Next I update the centre content column to switch the number format to bytes and the max significant digits to 0 (screenshot shows 3 but it should be 0...)
Then at the bottom of that screen i go to the colouring section and choose 'heatmap', I derive the colouring option from the value of the column1 (the sum of the bytes) field and I want the colour palette to go from green to red. I leave the min and max value to auto so it defines them itself based on the data.
What that then means is that the highest value comes up as dark red changing in colour down to green for the lowest value in the dataset. That way I get a nice visual representation of the biggest users.
The end result looking something like the below - you can see the private ip (redacted) of the filer at the top of each cluster. The honeycomb below then shows the total bytes per computer, I've removed the computer name from the actual display (which spoils the screenshot below a little, but it was too much data to redact....) - but each hexagon would have the computer name in it if you followed the steps above.
There you go - a nice way of visualising the data
There are loads more things you can do with workbooks, making then interactive, having tabs, having multiple datasets joined within them, linking out to external data via rest API - they are really powerful - more posts to come!


This actually works! My game runs way smoother now with Roblox FPS Unlocker no more annoying frame drops during action-packed moments.
ReplyDelete