We've a simple squid forward proxy in our environment and we wanted to be able to do some analysis on the logfiles from it. There are lots of ways we could do this but we wanted to be able to leverage what we already had in place with Azure rather than use yet another tool.
Let's me explain how we configured this and then how we could do some analysis from it.
The first thing you need to do is have the extension 'OMSAgentForLinux' deployed - this can be done manually following Microsoft notes but in most cases can just be directly deployed from the portal from the insights section under monitoring where it will create the agent deployment for you - here is an example of that screen (in a lot of cases if you are invested in Azure you will likely already have this)
Once that agent is deployed you will see a whole load of metric data is being collected and fed back to the log analytics workspace
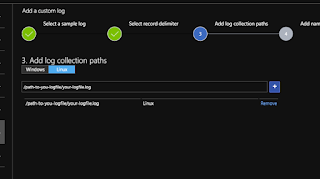
The additional bit to collect custom log data is simple - we just need to navigate to the screen below - this is just reached from the advanced settings part of the log analytics workspace
The screenshot already has my squid config there - but yours would be initially blank
To add the squid rule click the Add button and go through the steps below:
To enable the first screen to work you need to copy a few lines from the actual squid proxy log onto your local computer so the wizard can discover the file format.
Choose the new line option
Tell it where the file can be found
Give the 'bucket' where the log data will be put in log analytics a name
When you get back to the main screen make sure the 'apply below configuration to my linux machines' is ticked and you're done.
Now the agents will also collect data from the squid access logs (note it won't go back historically - it starts collected from the point of activation)
If you now go to the main log analytics screen you can query the bucket with the squid data in and you'll see something like this
Each line in the logfile becomes a record in log analytics and the data from each line becomes the 'RawData' column
So now we're most of the way there - now we just need to write a query to make the data into information
Here is how i converted the rawdata column into something more useful:
SQUID_PROXY_CL
|extend nospace = replace( @' +',@' ' ,RawData)
|extend proxdata=split(nospace, ' ')
|extend sourceip = proxdata[2]
|extend dest = proxdata[6]
|extend when = unixtime_milliseconds_todatetime(toreal((replace(@'\.',@'',tostring(proxdata[0])))))
Now to explain whats going on here - the extend keyword allows you to extend the data (and add new columns) - here is what my conversion steps are doing.....
nospace = make sure we only have a single space between fields - otherwise the following split command gets confused
proxdata = split the rawdata into columns using space as the separator
sourceip = take column 2 from the proxdata array we created in previous step
dest = same as sourceip but using column 6
when = convert that stupid squid epoch time format into something a human can understand (this actually took a while to figure out.....
Now when i run that query i see the data like this
Now it's in a usable format i can do what i like with it - for example i can create a pie chart of the top 10 destinations that we are proxying to
I can show the usage profile per hour like this:
You can also create alert rules based on some criteria too - so if you see any access to a certain site, or requests coming from an ip they shouldn't be you can build a query that identifies them and get this to trigger an alert - email/SMS or whatever - the system is very powerful.
You can also take a load of the defined queries and build yourself a 'proxy' dashboard showing what's relevant for you.
You could even use this on premises as the log analytics agent can be installed their too - the server just needs a way to be able to get to the public azure endpoint.
The more i use log analytics and Kusto - the more i like it - it's really powerful.With this method you can read any logfile and then perform graphing/reporting/alerting based on its content.


Comments
Post a Comment