As our use of Azure is continually expanding so is our requirement for effective reporting and governance of that. However there still seem to be some gaps into what is actually possible (unless i missed something - which is entirely possible as the platform seems to change on a daily basis.....).
For example if i want to directly report on azure resources from Power BI i can't natively do that - there doesn't seem to be an adapter that can just talk to the API's directly and pull the information back.
Take the simple case that i want a list of Azure VM's to show up in powerbi - that's not directly possible ( i do suspect though that this may be coming at some point this year).
I can however produce a way of doing this quite simply using a couple of techniques i picked up recently - all of the bits i think are useful anyway even if they are then used for completely other use cases.
So my high level plan to do this is to write a simple powershell script that can make use of the new (still in preview) azure resource graph functionality - this is able to query across all subscriptions in one go. That's a massive improvement over scripts we currently have that have to loop through every single subscription and repeat the same command in each one. The results of that query get dumped to Azure Storage - from there I can then access directly in power BI. So lets put that all together and see what we have.
Stage 1 - build the Powershell part
All of the powershell part i am doing 'serverless' - the future is here people.....
To do this i activate the new AZ resource graph modules in an azure automation account I already have - this is actually far easier than I initially realised - you just need to make use of this button on the portal:
(I had previously been trying to import from github or from command line operations - none of which worked - you just simply have to click the import option from the module you want to load).
For this test bit of code i needed the resource graph one - shown below
However - note here that you can't mix and match the old modules with the new ones - so I also had to load the az.accounts and az.storage modules too
Once all the modules are available I can write this simple bit of powershell to accomplish what I need to do:
Here is what it looks like on screen
But i guess more importantly here is the actual code
#Login Azure
        $conn = Get-AutomationConnection -Name "AzureRunAsConnection"
        Add-AzAccount -ServicePrincipal -Tenant ($conn).TenantID -ApplicationID ($conn).ApplicationID -CertificateThumbprint ($conn).CertificateThumbprint
        #Select Azure Subscription

Search-AzGraph -Query "where type =~ 'Microsoft.Compute/virtualMachines'|project name,tags.Owner,tags.iteraplanid,properties.storageProfile.osDisk.osType,properties.storageProfile.imageReference.sku,properties.osProfile.adminUsername,resourceGroup,subscriptionId" | Export-Csv -Path .\extract.csv -NoTypeInformation

$Context = New-AzStorageContext -StorageAccountName "storageaccountnamehere" -UseConnectedAccount

set-AzStorageblobcontent -File ".\extract.csv" `
  -Container cmdb `
  -Blob "extract.csv" `
  -Context $Context
So only a few lines - basically connect, run a resource query, get the data into azure storage. You just need to make sure the automation account has the right permissions it needs to access everything.
So at this point we have the data in a public endpoint - it's a 'snapshot' of course - but we can schedule the runbook to regularly overwrite the file and keep the content 'fresh'
We can now browse the csv and look at it in the portal
So that's stage 1 done - now we just need to view that in power bi.
Stage 2 - build the Power BI part
(disclaimer - i knew nothing at all about powerbi until a few weeks ago......)
So first up in powerbi desktop (sorry seems this isn't available in web...) select azure blob storage as the source
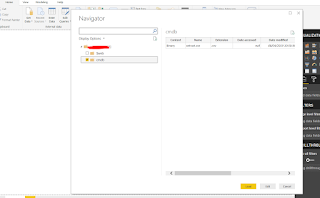
Choose the file we just created
Now the clever part - click the edit button rather than the load button - then click the double arrow from the content header - circled in the screenshot below.
That takes you into a wizard that will actually process the content of the file - you can actually do a huge amount of processing here - filtering data - combining columns - it's actually a very powerful ETL tool......
The end result is then a datasource in the exact format you want it to report off - I did a very simple pie chart of linux vs windows just to demo below - but you can write any report you like.
The report itself can be scheduled and this will then reprocess the data source each time so you have an up to date report of your azure resource.
Quite neat I thought - although i fully expect some new feature to make this all possible at the click of a button any day soon.....


Enjoyed reading the article above, really explains everything in detail, the article is very interesting and effective. Thank you and good luck for the upcoming articles Learn power bi online training
ReplyDeletegreat post!
ReplyDeleteNfronimpecyu_Newark Anish Ruth https://wakelet.com/wake/VaxJjO1fe3sDJAHLg1LwA
ReplyDeletesormaranfall