
Post our patch to 12.1.0.5 cloud control i was having a look at the general db performance of the OMS repository. It was actually pretty bad and i didn't know if the patch caused it or it had been bad for a while (actually i still don't know which is the reason). If you take a look at the db performance window for the repo i see this pattern - you can see it's 'pretty busy' with internal processes.

All of the main activity seems to derive from one update statement picked out here

So the code is just running what looks like a simple update statement :
UPDATE EM_METRIC_ITEMS SET IS_CURRENT = '0' WHERE METRIC_GROUP_ID = :B3 AND TARGET_GUID = :B2 AND IS_CURRENT = '1' AND LAST_COLLECTION_TIME < :B1
Lets have a look at SQL monitoring and see why that statement is taking so long

If we choose one of them and look a little closer we can see it seems to be estimating hardly any rows but processing 17 million of them.

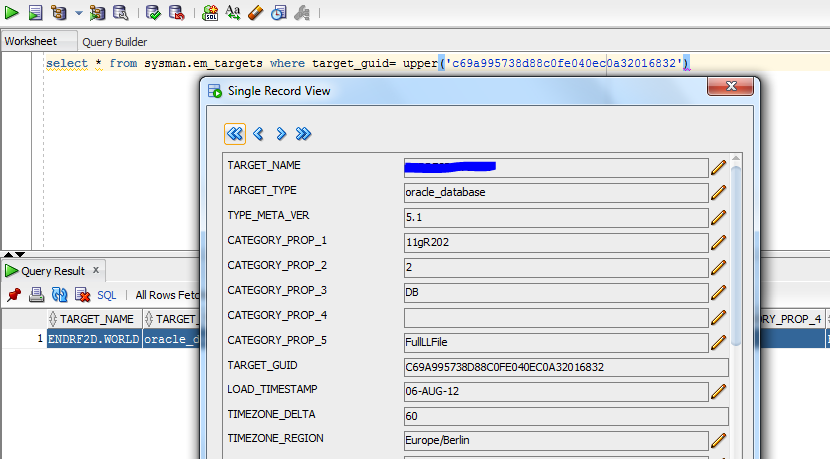
Clicking on the little icon shown above we can show the full SQL and then in the screen below we can actually get easy access to the bind variables - a nice new 12c addition.

So whats going on why is there so much data here?
Using the binds i pulled out i ran a couple of other statements - the first below shows which metric we are talking about:

This is actually one i added to collect table size information for every table in a database every 15 minutes... - this adds up to an awful lot of data (I also changed the repo retention time so nothing gets purged for years.....)
To further confirm which target this is actually from i ran the following SQL
Looking at the nature of the SQL again it's just flagging rows as active/inactive and there are actually very few with the status is_current=1 so an index on that might solve the issue? We can see the split of values in the output below:

So i added the following index
create index not_oracle_added_by_us_idx on em_metric_items(target_guid,metric_group_id,is_current) compress 2 online;
And sat back to see the results - lets just say there were mixed..... The original SQL was fixed fine - however i screwed up another piece of SQL - the one shown below :

Damn - not what i intended - i decided maybe it's the compression making the index much more attractive than the PK it should be using!
i had to stop the OMS at this point to be able to drop the index...... - i then recreated it like this
create index not_oracle_added_by_us_idx on em_metric_items(target_guid,metric_group_id,is_current) online;
However that still had the same issue.
I decided therefore the massive data skew was the issue and histograms were needed - so i ran this
SQL> exec dbms_stats.gather_table_stats('SYSMAN','EM_METRIC_ITEMS',method_opt=>' for all indexed columns ');
BEGIN dbms_stats.gather_table_stats('SYSMAN','EM_METRIC_ITEMS',method_opt=>' for all indexed columns '); END;
*
ERROR at line 1:
ORA-20005: object statistics are locked (stattype = ALL)
ORA-06512: at "SYS.DBMS_STATS", line 34634
ORA-06512: at line 1
And found that oracle probably don't want you messing round with this.... I pressed ahead though and forced the stats change.
SQL> exec dbms_stats.gather_table_stats('SYSMAN','EM_METRIC_ITEMS',method_opt=>' for all indexed columns ',force=>true);
PL/SQL procedure successfully completed.
And now...?

Performance is way better - the only bad statement now is the one shown below everything else seems fine. No idea what this SQL is for but it seems to run infrequently so I'll ignore it for now- the SQL is shown below

So there we have it i used cloud control to tune cloud control, i should perhaps consider how much data i'm retaining and how often to collect that rather than doing this 'fix'.
The fix being the index and the histogram to get the desired result.
I nice example of the usefulness of the toolset though i think you'll agree.
Comments
Post a Comment