We've had a requirement come in for a couple of systems now where we want to be able to plot table growth over time within the system. By default there is nothing in place to capture this information - you can go back a few days, maybe weeks by looking at historical version of what the optimizer gathered and you can see tablespace growth from what's in cloud control, but there is nothing specific to tables.
I wanted to use cloud control to do this as to me this just seems like another 'metric' to gather, in this case for historical trending rather than basing any kind of alerting off those values.
I wanted to make sure that however it was done was re-usable and easy to deploy to any other system.
Here is how i went about it.........
First up navigate to the metric extensions screen (this only appeared in 12.1.0.3 i think , maybe 12.1.0.2 i can't quite remember - these are much better than the old udm's and i suggest you switch to them)
Enterprise->monitoring->metric extensions
On this screen click create to create a new one, once this is done fill in the basic metric details - i called mine ME$TABLE_SIZE_HISTORY but you can call it anything you like
Move on to the next screen and define the simple SQL query against DBA_TABLES that will return the owner,table_name,num_rows and num blocks. I also added sysdate during my testing but this is not required and can be ignored.
The next screen maps columns returned from the SQL to columns that will be used by the metric inside cloud control. The names don't matter here (there is no relation to the column name - it's just the order that is important)
You can see the detail for one of mine here
The main thing to define here is that sysdate (in my case but you can remove this column),owner and table_name are all 'key' columns and num_rows and num_blocks are 'data' columns.
Next up its credentials credentials - here i just use the target default though you can override it
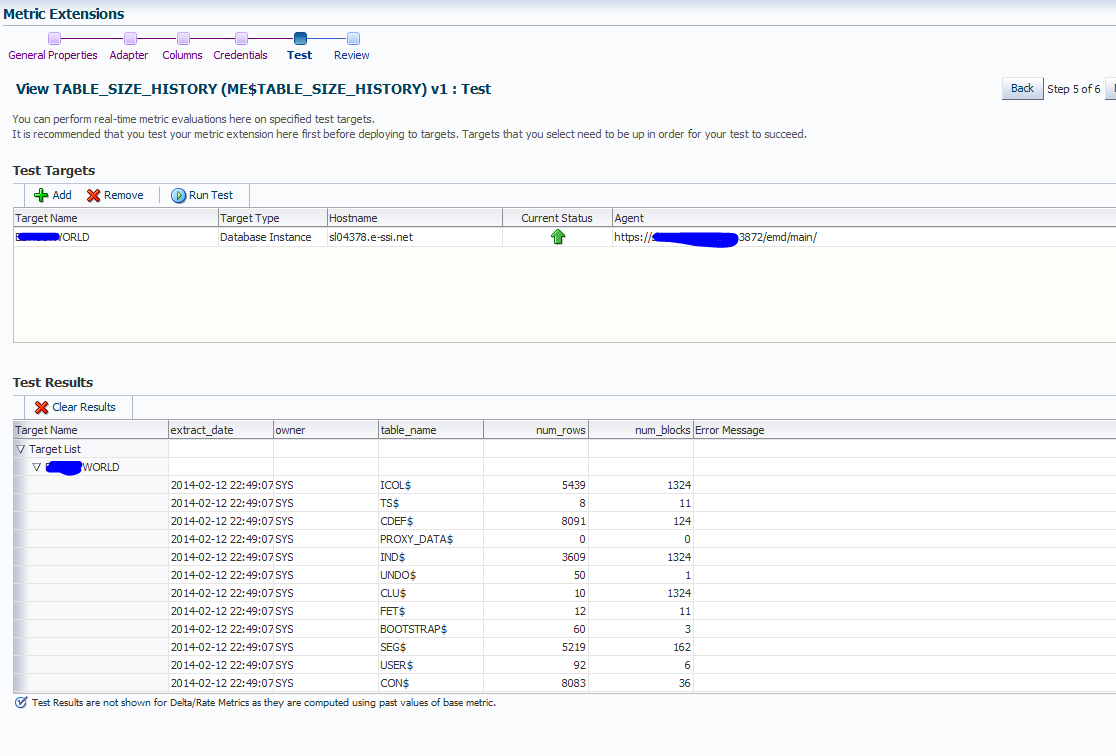
Then we get to a screen where we can test that the metric fetches the value we expect, you can test against one or many targets and the results are displayed in the pane at the bottom.
If all looks ok we move to the summary screen and complete the creation
OK so it's looking good so far, however at the moment this metric is defined by doesn't actually run anywhere. We need to deploy it to all the targets we are interested in.
To do this we go back to the metric extensions home screen, click on the extension we just created and then from the actions menu choose deploy to targets
This then prompts for list of targets from which you select and then submit
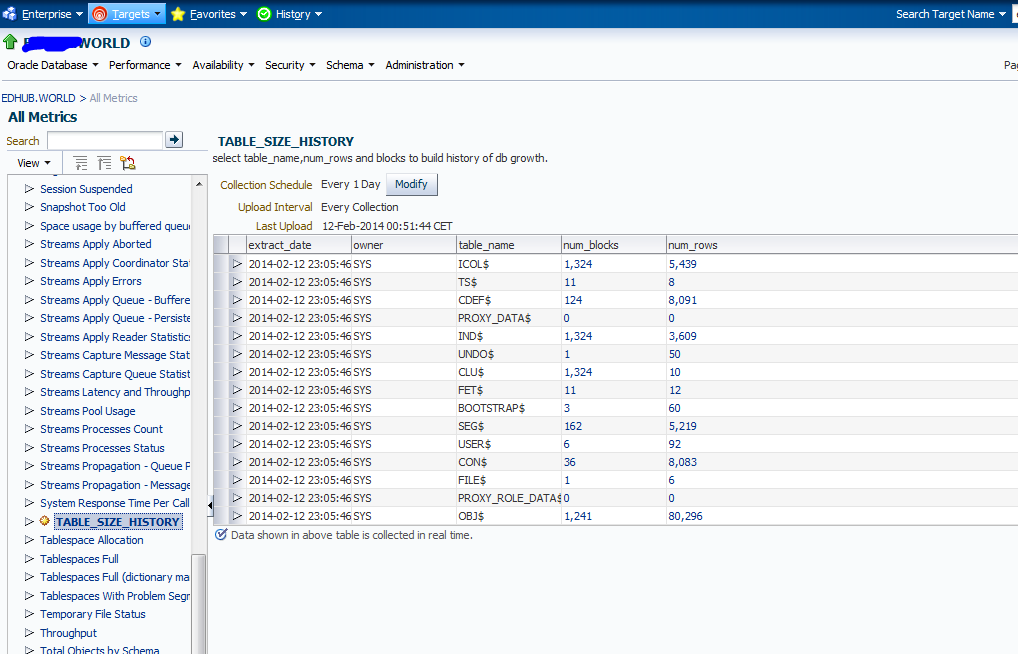
And now it's deployed and will be collecting values - we can see this by navigating to the all metrics screen of the target database
Here we can see the real time values as it just ran the SQL directly but we can also see the last time the scheduled upload was done. According to the screens when i built the metric the first run of the metric should be immediately after deployment - for me that didn't happen though - it was some random time afterwards.
Right - we're getting closer the agent is now collecting the information and putting it in the repository but how do we actually query it? The screens in grid control clearly can;t cope with trying to give us the data in the format we want so we have to query the repository directly.
Now initially when you start looking at all the 'stuff' in the repository it's quite a surprise - there is a huge amount in there...
But i've done the hard work for you.....
The main tables involved in holding this data are.....
em_metric_values (all of the raw metric data held for 7 days before deletion
em_metric_values_hourly (data aggregated up to an hour - held for 31 days)
em_metric_values_daily (data aggregated up to a day - held for 12 months)
The aggregation that happens just averages/max/mins the data for that metric up to that aggregation level, so if you had a metric collecting every 5 mins the hourly data would be the average of those 20 collections etc.
As we are only collecting the data once per day in this case (which is probably too often) the aggregation has no effect really as there is only one set of data points.
So to now query the data out of these tables what SQL do we run? Oracle has some views based on these underlying tables and i based my query on those.
So to display data from the 'raw' 7 days worth of data we would run this
SELECT mv.value,mv.collection_time,mv.metric_column_name,
KEY_PART_1 KEY_PART1_VALUE, KEY_PART_2 KEY_PART2_VALUE, KEY_PART_3 KEY_PART3_VALUE
FROM sysman.GC_METRIC_VALUES mv,MGMT_TARGETS MT
WHERE ENTITY_GUID = MT.Target_Guid
AND METRIC_COLUMN_NAME in ('num_rows','num_blocks')
and target_name='<your target name here>'
To query it from the 'hourly aggregation we would do this (the main difference being we have to use the 'max' value rather than just the value even though they are essentially the same in this case
SELECT mvd.max_value,mvd.metric_column_name,
KEY_PART_1 KEY_PART1_VALUE, KEY_PART_2 KEY_PART2_VALUE, KEY_PART_3 KEY_PART3_VALUE
FROM sysman.GC_METRIC_VALUES_HOURLY mvd,MGMT_TARGETS MT
WHERE ENTITY_GUID = MT.Target_Guid
AND METRIC_COLUMN_NAME in ('num_rows','num_blocks')
and target_name='<your target name here>'
Here is a screenshot from plsql developer showing that data
Now we have the data in a form we can use we can do what we like with it to graph up table growth and do any kind of analysis.
I thought at this point that 1 year is probably not enough to do proper trending and the 1 year retention could be a problem - however happily this is easily extended - you just might need a lot more disk space to store all the info. Details on that are here from the 12c docs
http://docs.oracle.com/cd/E24628_01/doc.121/e24473/repository.htm#BGBJHIEH
In summary these seems to be a very simple way of achieving the desired result, we can define it once and have it applied to multiple systems at will with very little effort and we need to deploy no extra framework/code (as most other solutions would require) we just make use of the infrastructure we already have.
The same principle could be applied to any other additional data that needed to be collected for trend analysis.
This illustrates again the huge power of cloud control and why it's out tool of choice for management/monitoring of all of our oracle systems.


Comments
Post a Comment