It's still a surprise to me (and i'm sure i'm missing it somewhere in what's built into cloud control) but I can't find any metric related to "has there been a backup in 'x' days"? It seems to know whether backups have been succesful on various status pages but there seem to be no metric based on that.
So i decided to create my own and at the same time try out the new metric extensions that replace user defined metrics in 12.1.0.3. (First impressions of the new style setup are very good by the way)
Before i did anything in cloud control i had to find a simple SQL query that could be run against any database target to tell me when the last succesful full/inc 0 backup of the database was. Our backup scripts do full backups as incremental 0 so they don;t show up as DB full which is annoying and you have to find them in a slightly different way - this is the SQL i came up with. It does imply that you have to have had an incremental backup at level 0 at some point (it doesn't handle cases where there haven;t been - mental note this is an easy fix....just get on and do it with nvl,
Anyway here is the SQL..... (there is more than one way of doing this i'm sure)
select min(sysdate - bjd.start_time)
from v$rman_backup_job_details bjd,
v$backup_set_details bsd
where
bsd.session_recid = bjd.session_recid
and bsd.session_key = bjd.session_key
and bsd.SESSION_STAMP =
bjd.SESSION_STAMP
and bsd.BACKUP_TYPE ||
bsd.INCREMENTAL_LEVEL = 'D0'
and bjd.status = 'COMPLETED'
Now all i have to do is get cloud control to tun this regularly against all of my database targets - easy you say...... (well actually it is pretty easy just quite a few screen to click through to make that happen).
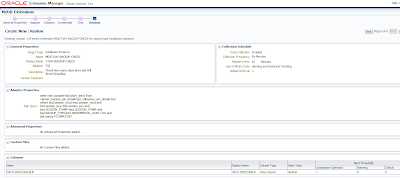
Here is a selection of screenshots through the whole process to show you what has to be done - cue picture overload....
First thing to do is open the new metric extensions link:
Then click create:
Then enter some basic details and the fact it is a SQL based metric
Then enter the SQL i defined earlier
Create a new column
Then define the details of that column
Use default credentials
Test it works against a database
review everything
Success!
Then click save as deployable draft, followed by publish metric extension
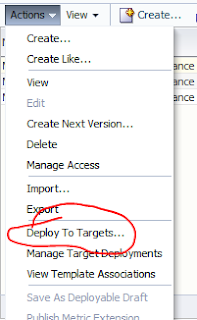
Then deploy to some targets
Add some to the list
Goes through various stages
And done - we can now browse to a database host and see the metric value
Now we just need to associate that metric with an incident/notification and we'll get an email/alert telling us something is wrong!
Going through this new process and seeing some of the options there are this looks like an incredibly powerful addition/extension to grid control (and earlier version of cloud control) and it all seemed to work seamlessly - I'm very impressed with what Oracle have done.
Next post will show how to subscribe to these alerts!


Nicely documented...thanks for posting
ReplyDeleteInterestingly simple to follow.
ReplyDeleteThat was well written.
great thanks, happy to say i did it nearly the same way
ReplyDeleteWould love to see a break down of the query and how to add the nvl part
Hi,
ReplyDeleteBy a strange coincidence i just had to update this for 12c - here is the details for that
http://dbaharrison.blogspot.de/2015/06/12c-subtle-backup-view-differences.html
Cheers,
Rich
Hi,
ReplyDeletenice post, thanks - does metric extension require additional licensing ?
BR
MiPs
This comment has been removed by the author.
ReplyDelete